Case study
Sustainability insight center
Shipping sustainability metrics across compute, networking and storage on a three-month timeline, and setting the vision for what came next.
- Role
- Design strategy lead and mentor
- Timeline
- Three months to deployment
- Partners
- Sustainability innovation team, PM, engineering
- Launch
- HPE Discover 2023, Las Vegas
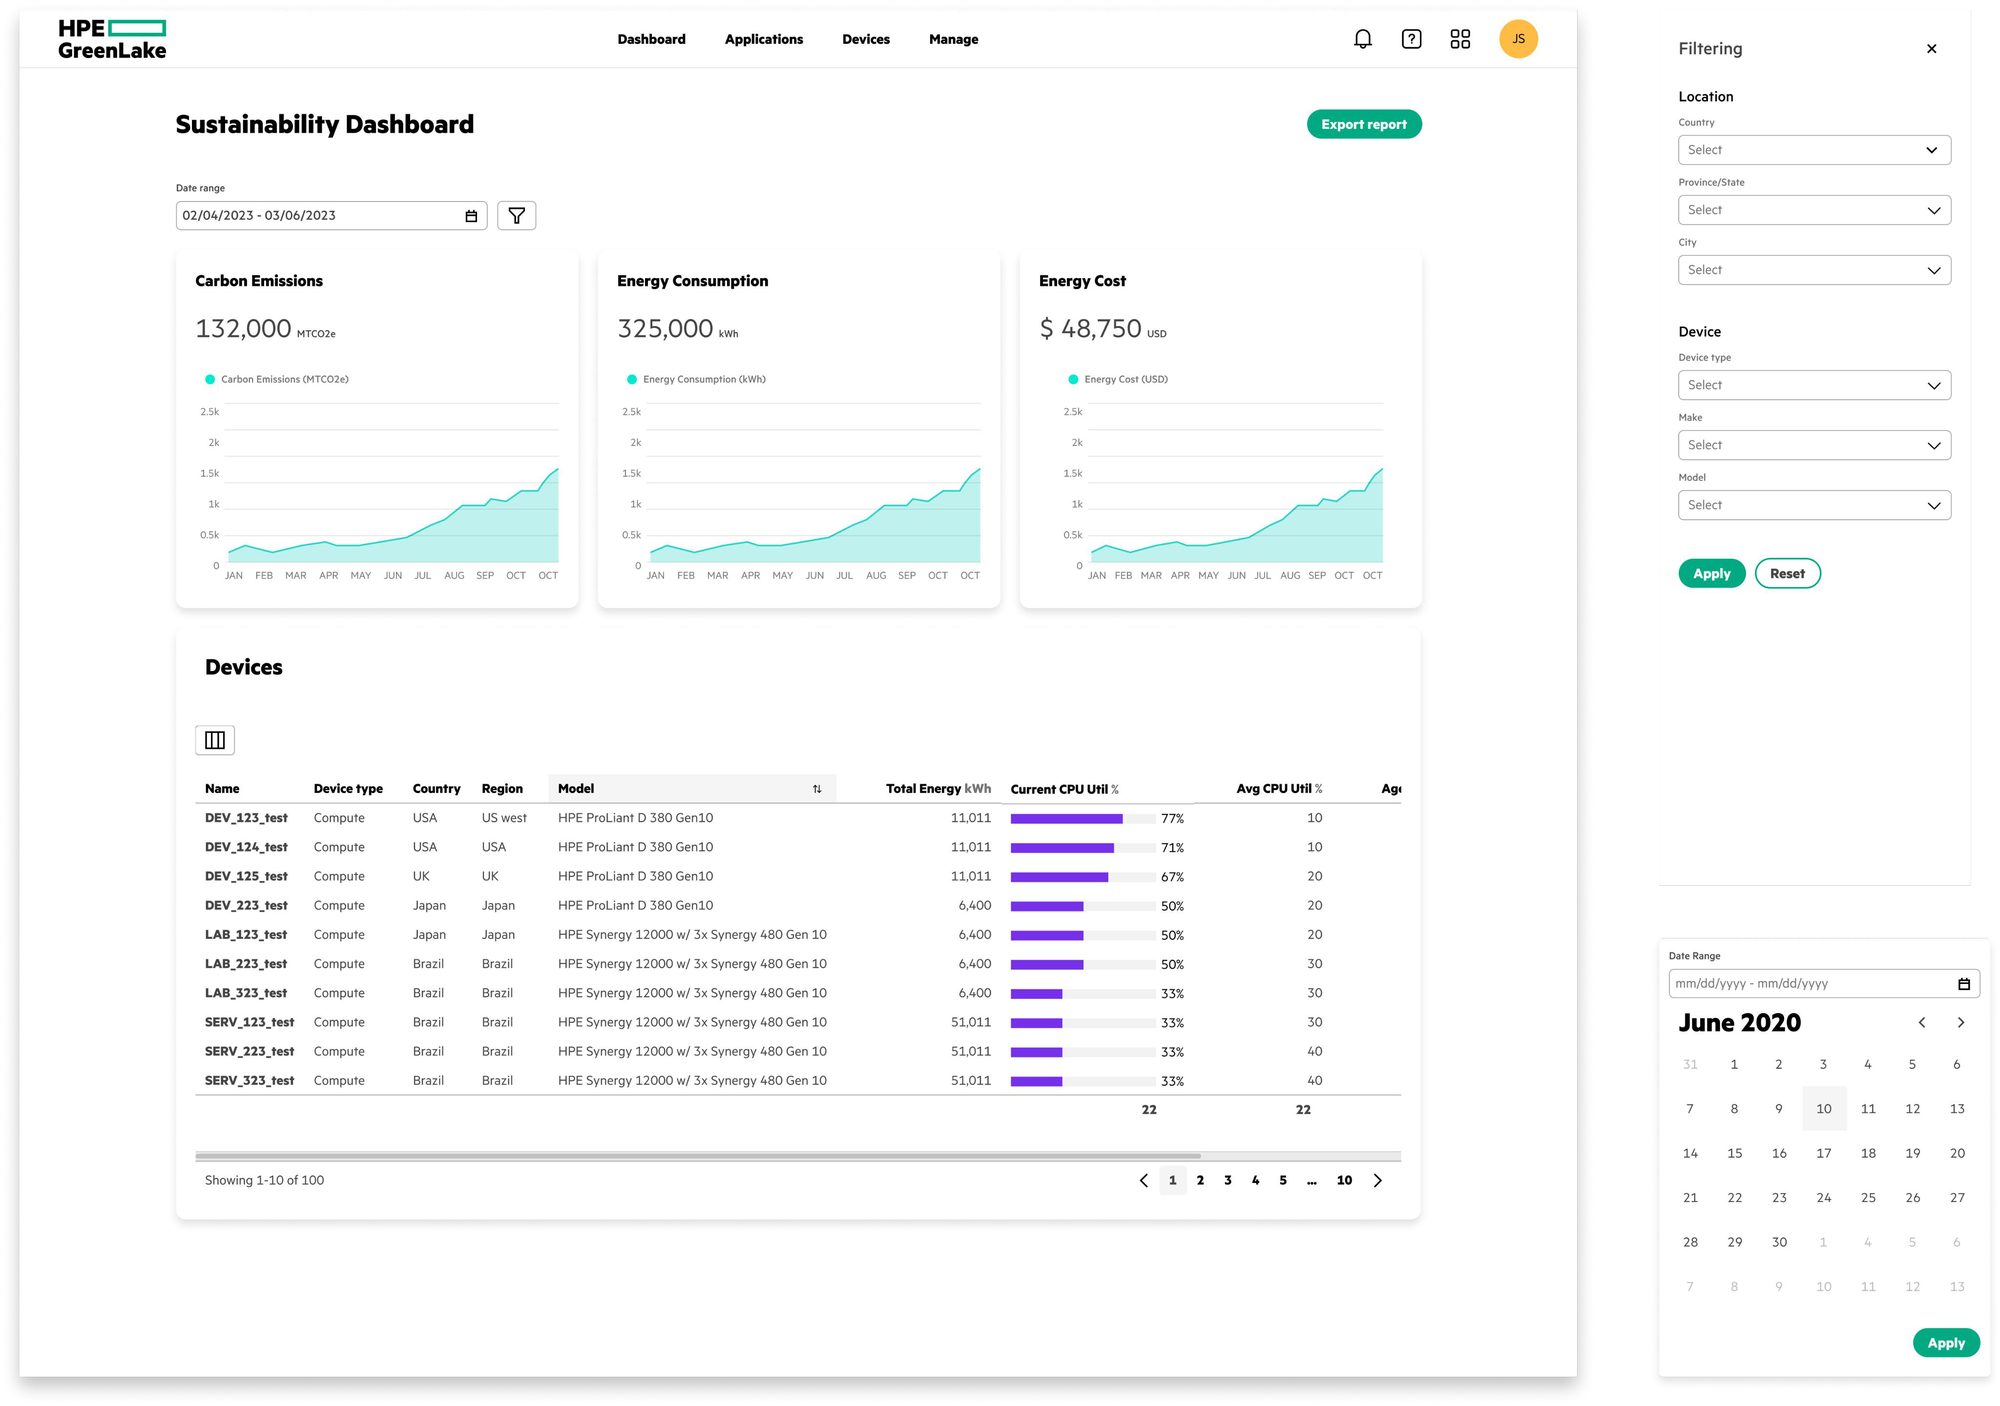
End-to-end rapid deployment
HPE GreenLake wanted to bring in an innovation project that shared sustainability metrics across compute, networking and storage devices. I led the design strategy while mentoring another product designer to drive an end-to-end solution, with three months to deploy.
Partnering with the sustainability innovation team, product management and engineering, we delivered a design that could scale and grow.
Co-creative collaboration
We worked with the product lead and engineering team almost every day, building on nearly a year of customer engagement and sustainability metrics from the innovation team.
With so little time, I steered the design toward a simple, direct set of metrics, prioritized by the existing data and checked with the sustainability team. We built a rapid prototype and gathered stakeholder feedback, iterating within days.
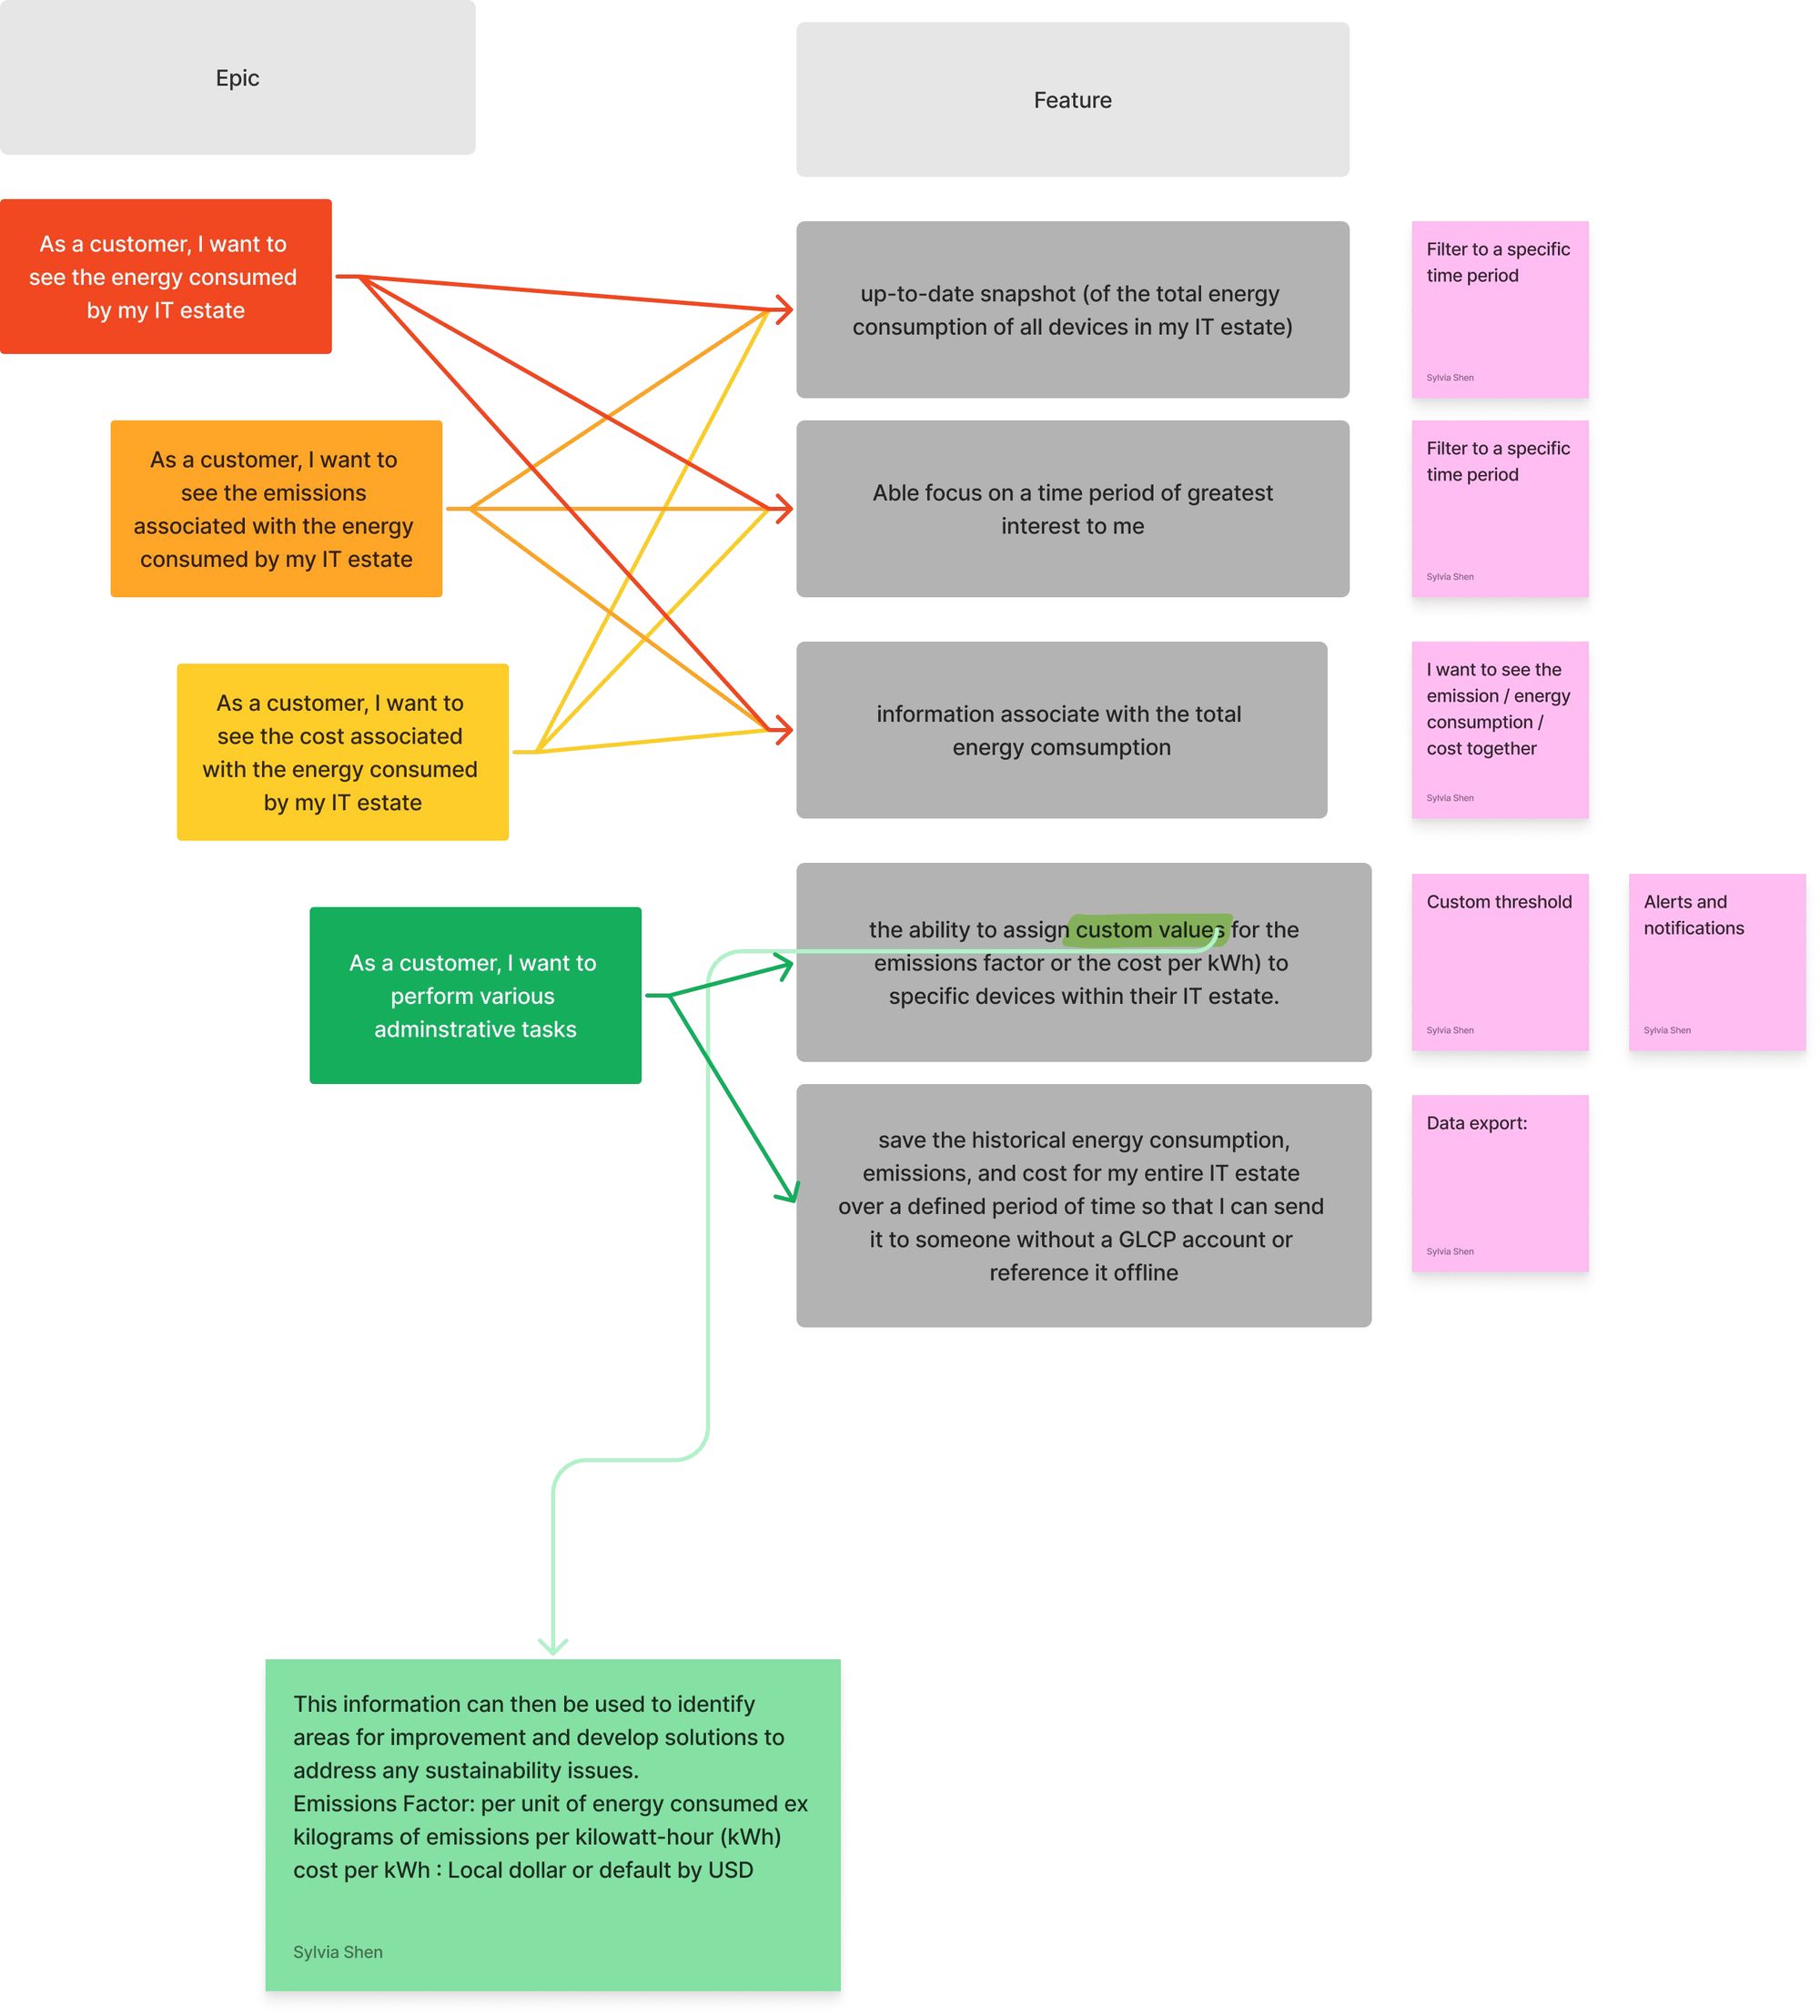
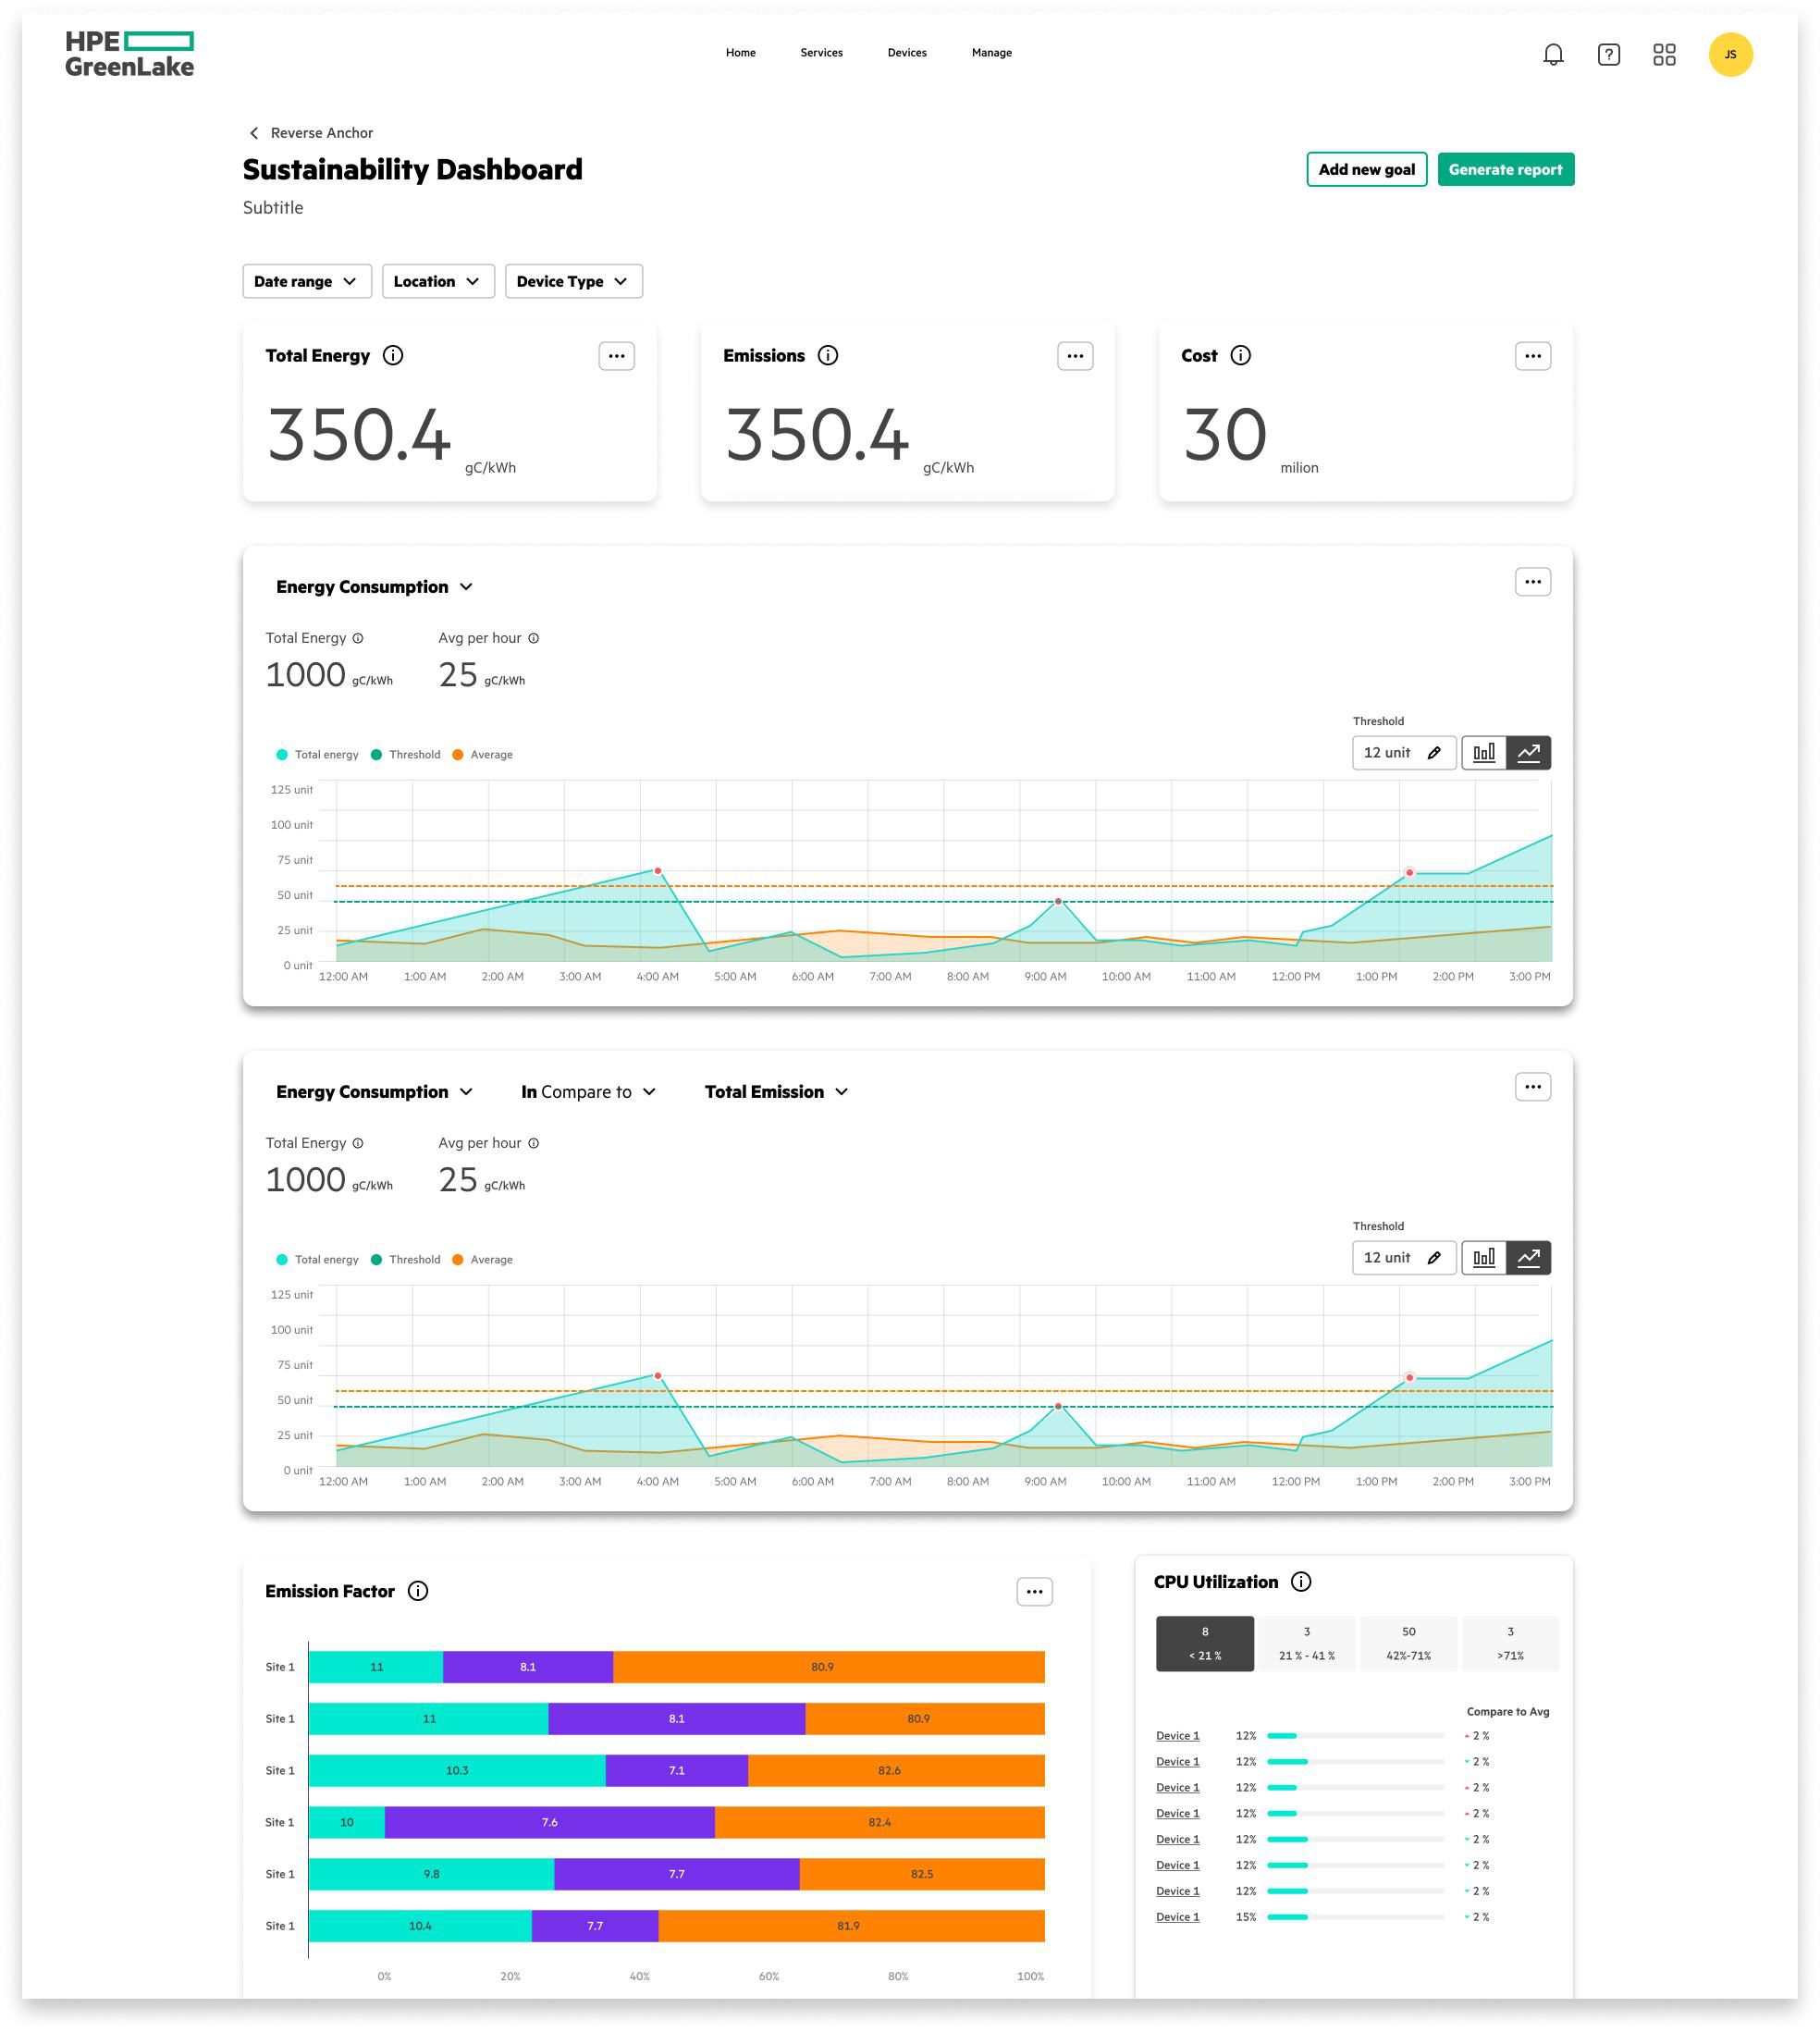
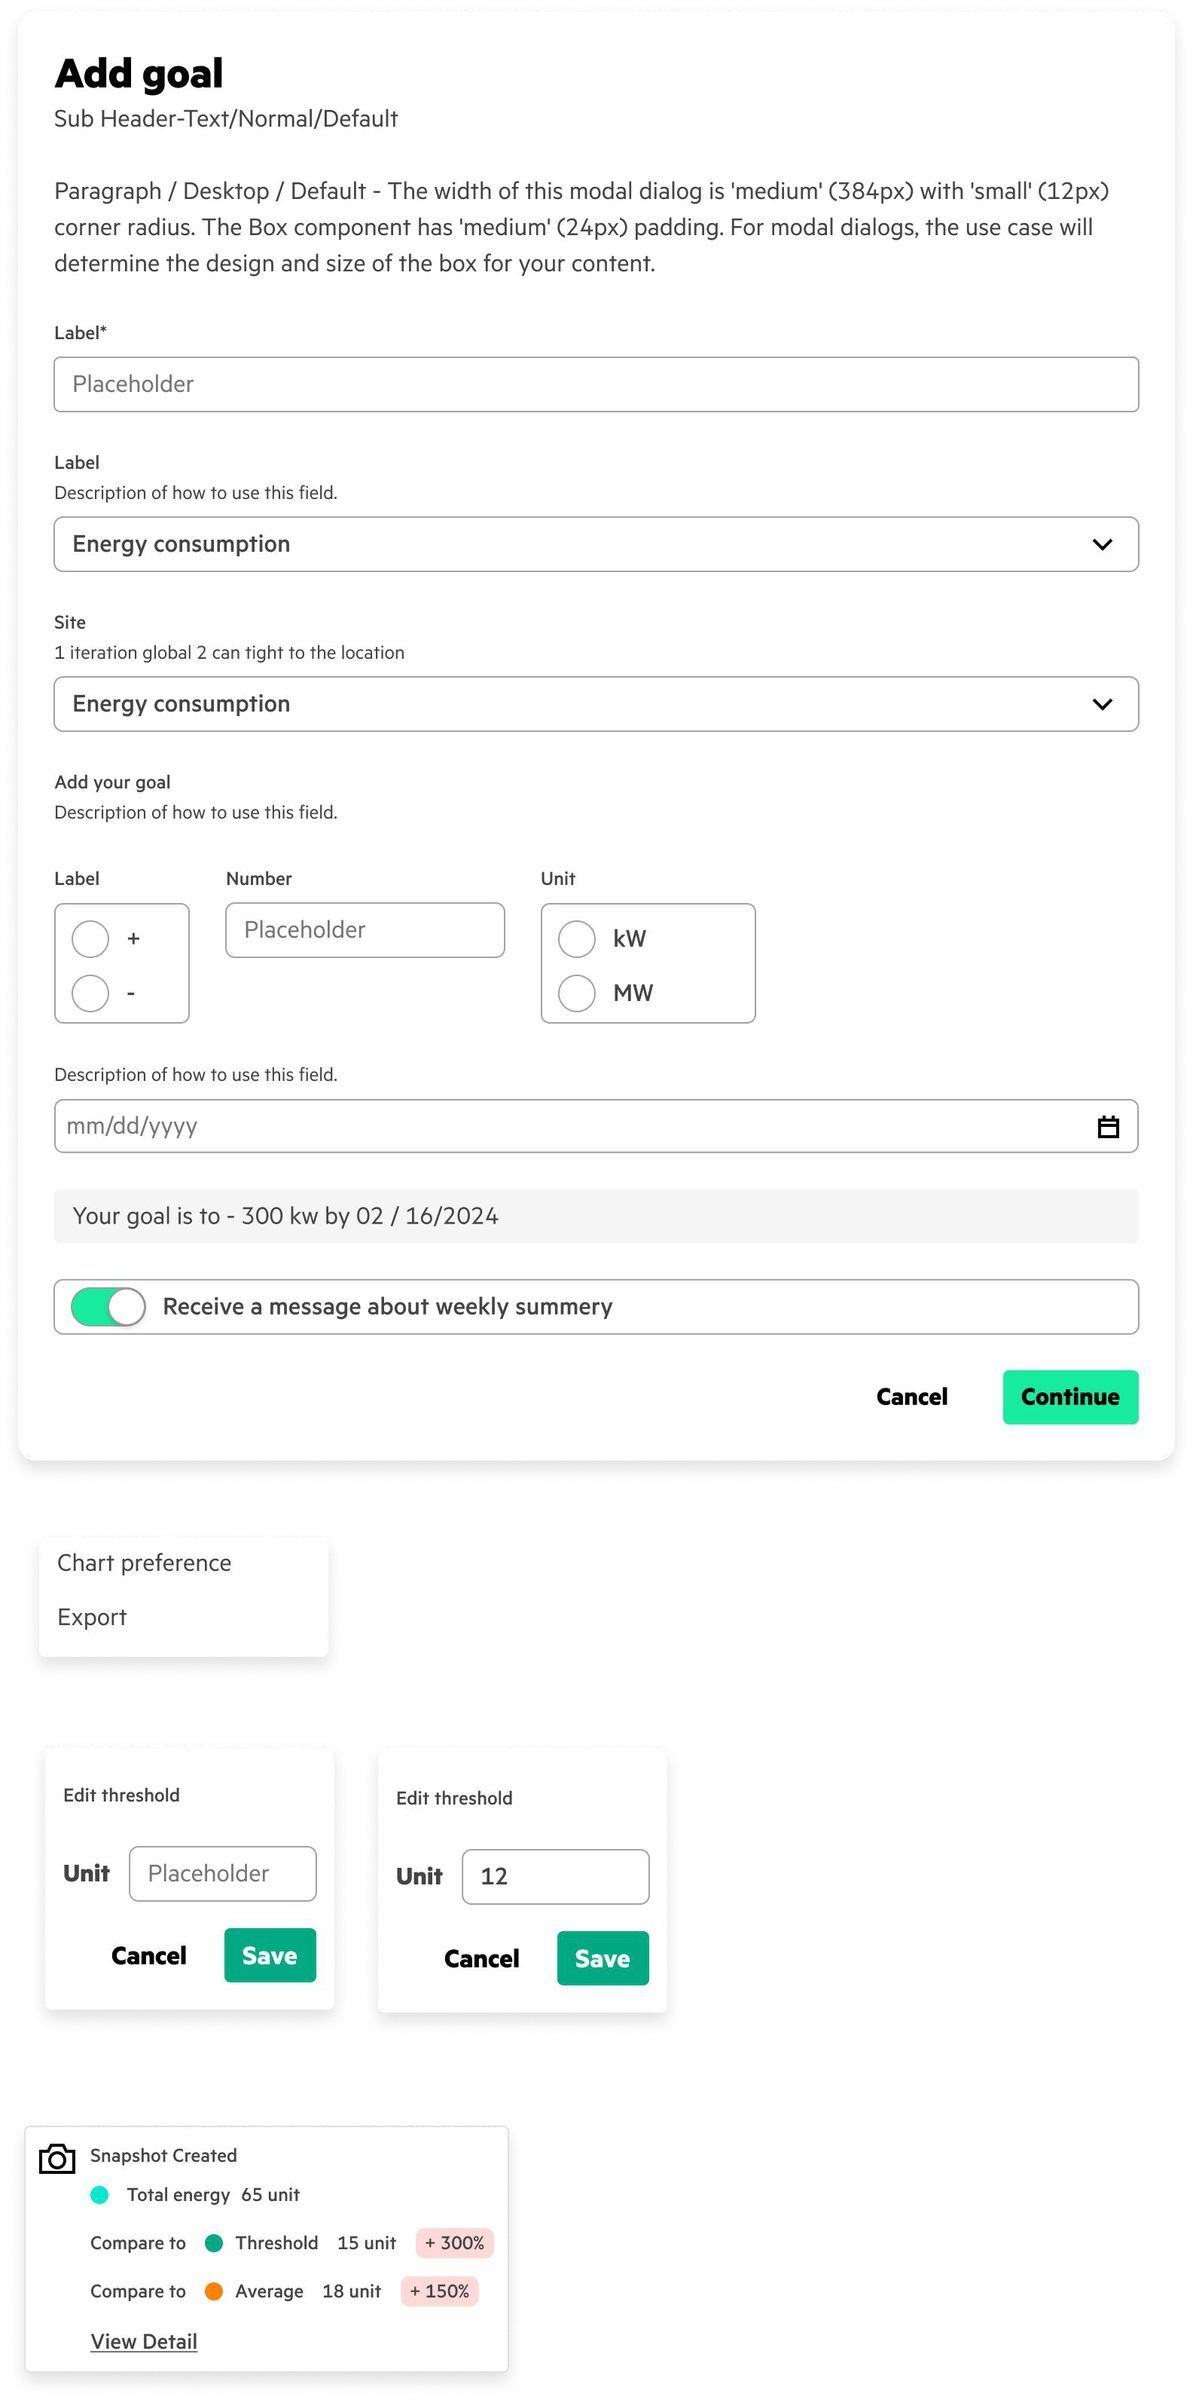
Working within constraints to create a vision for the future
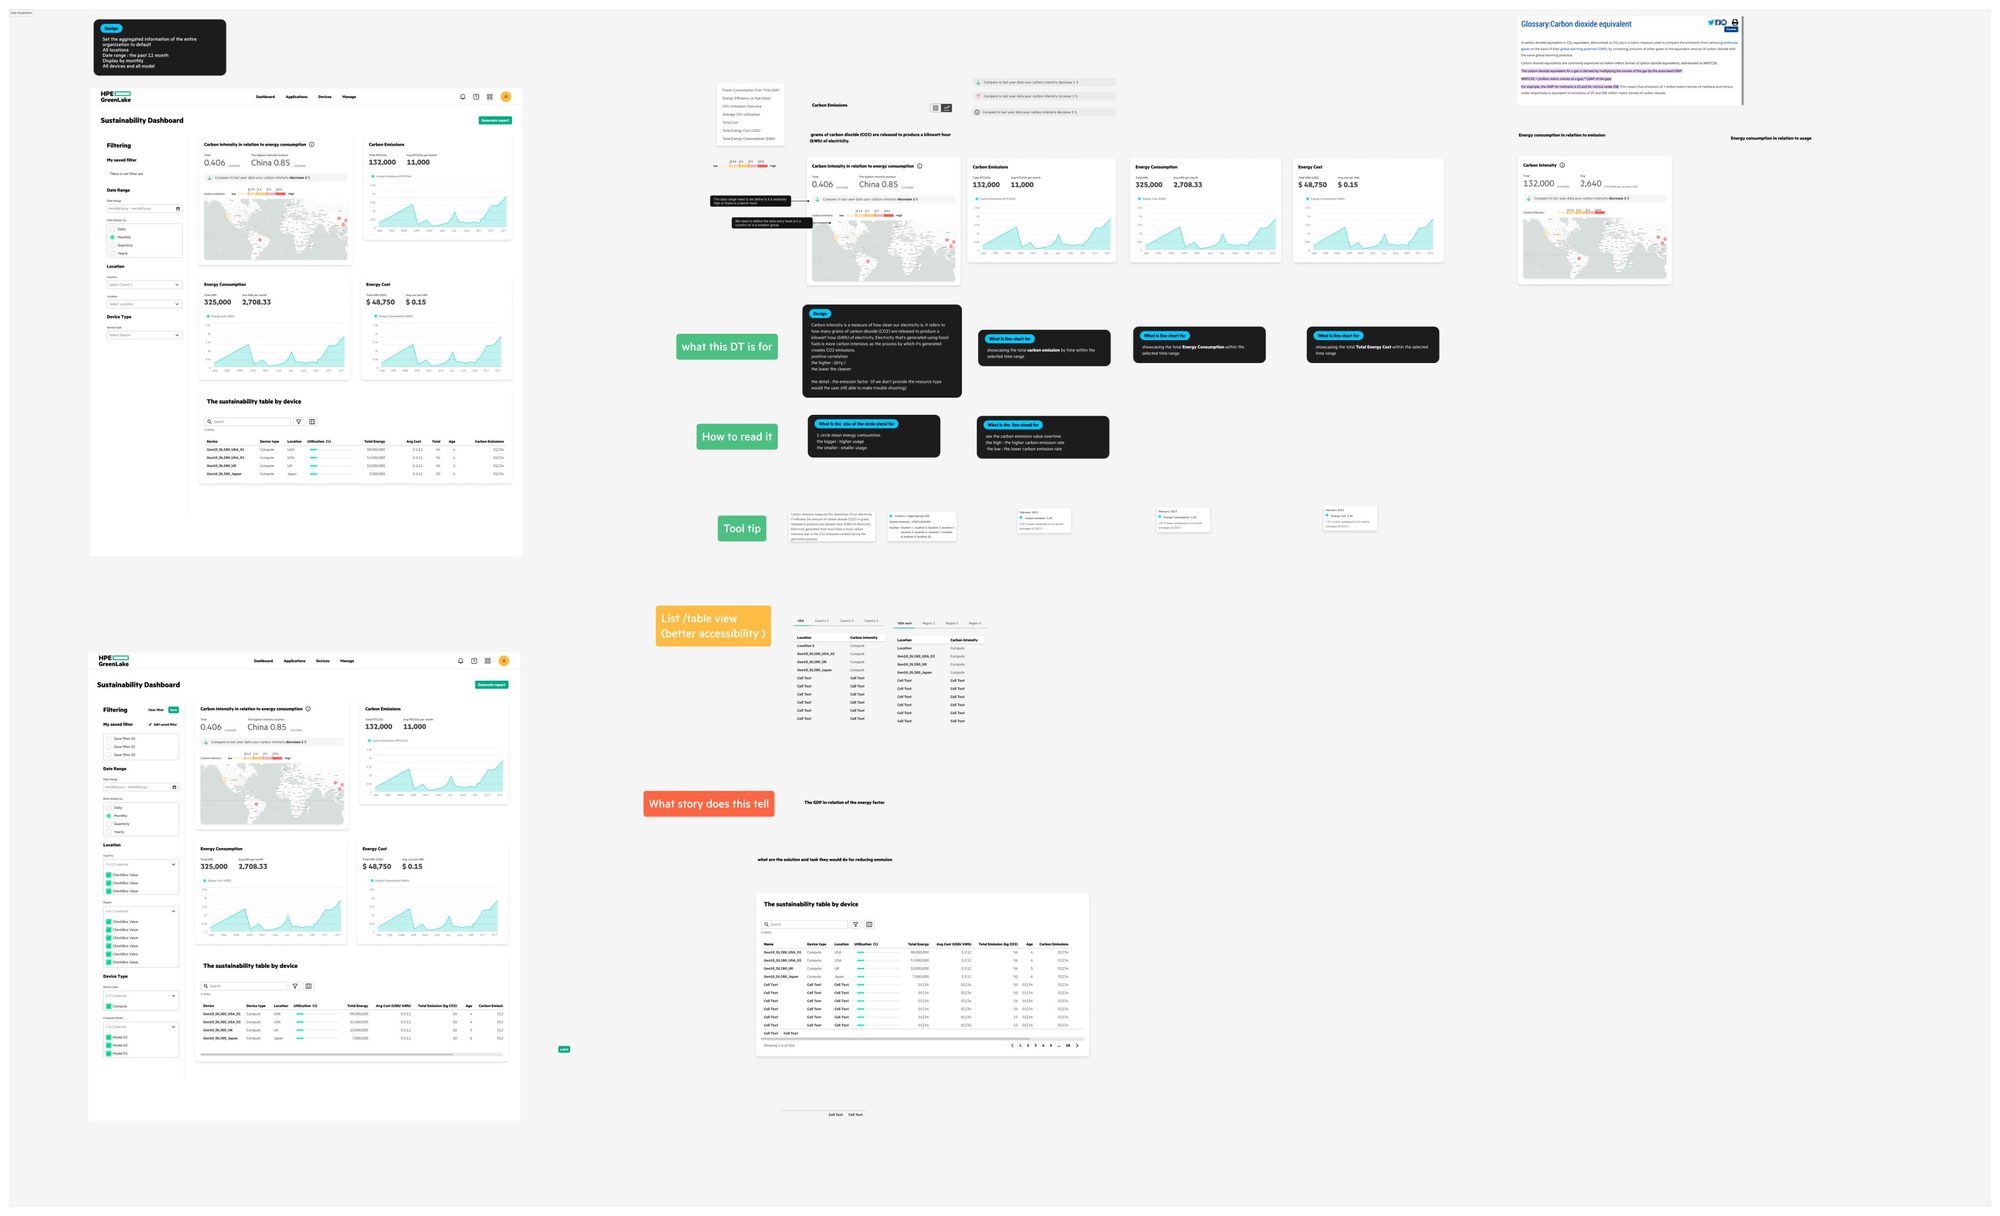
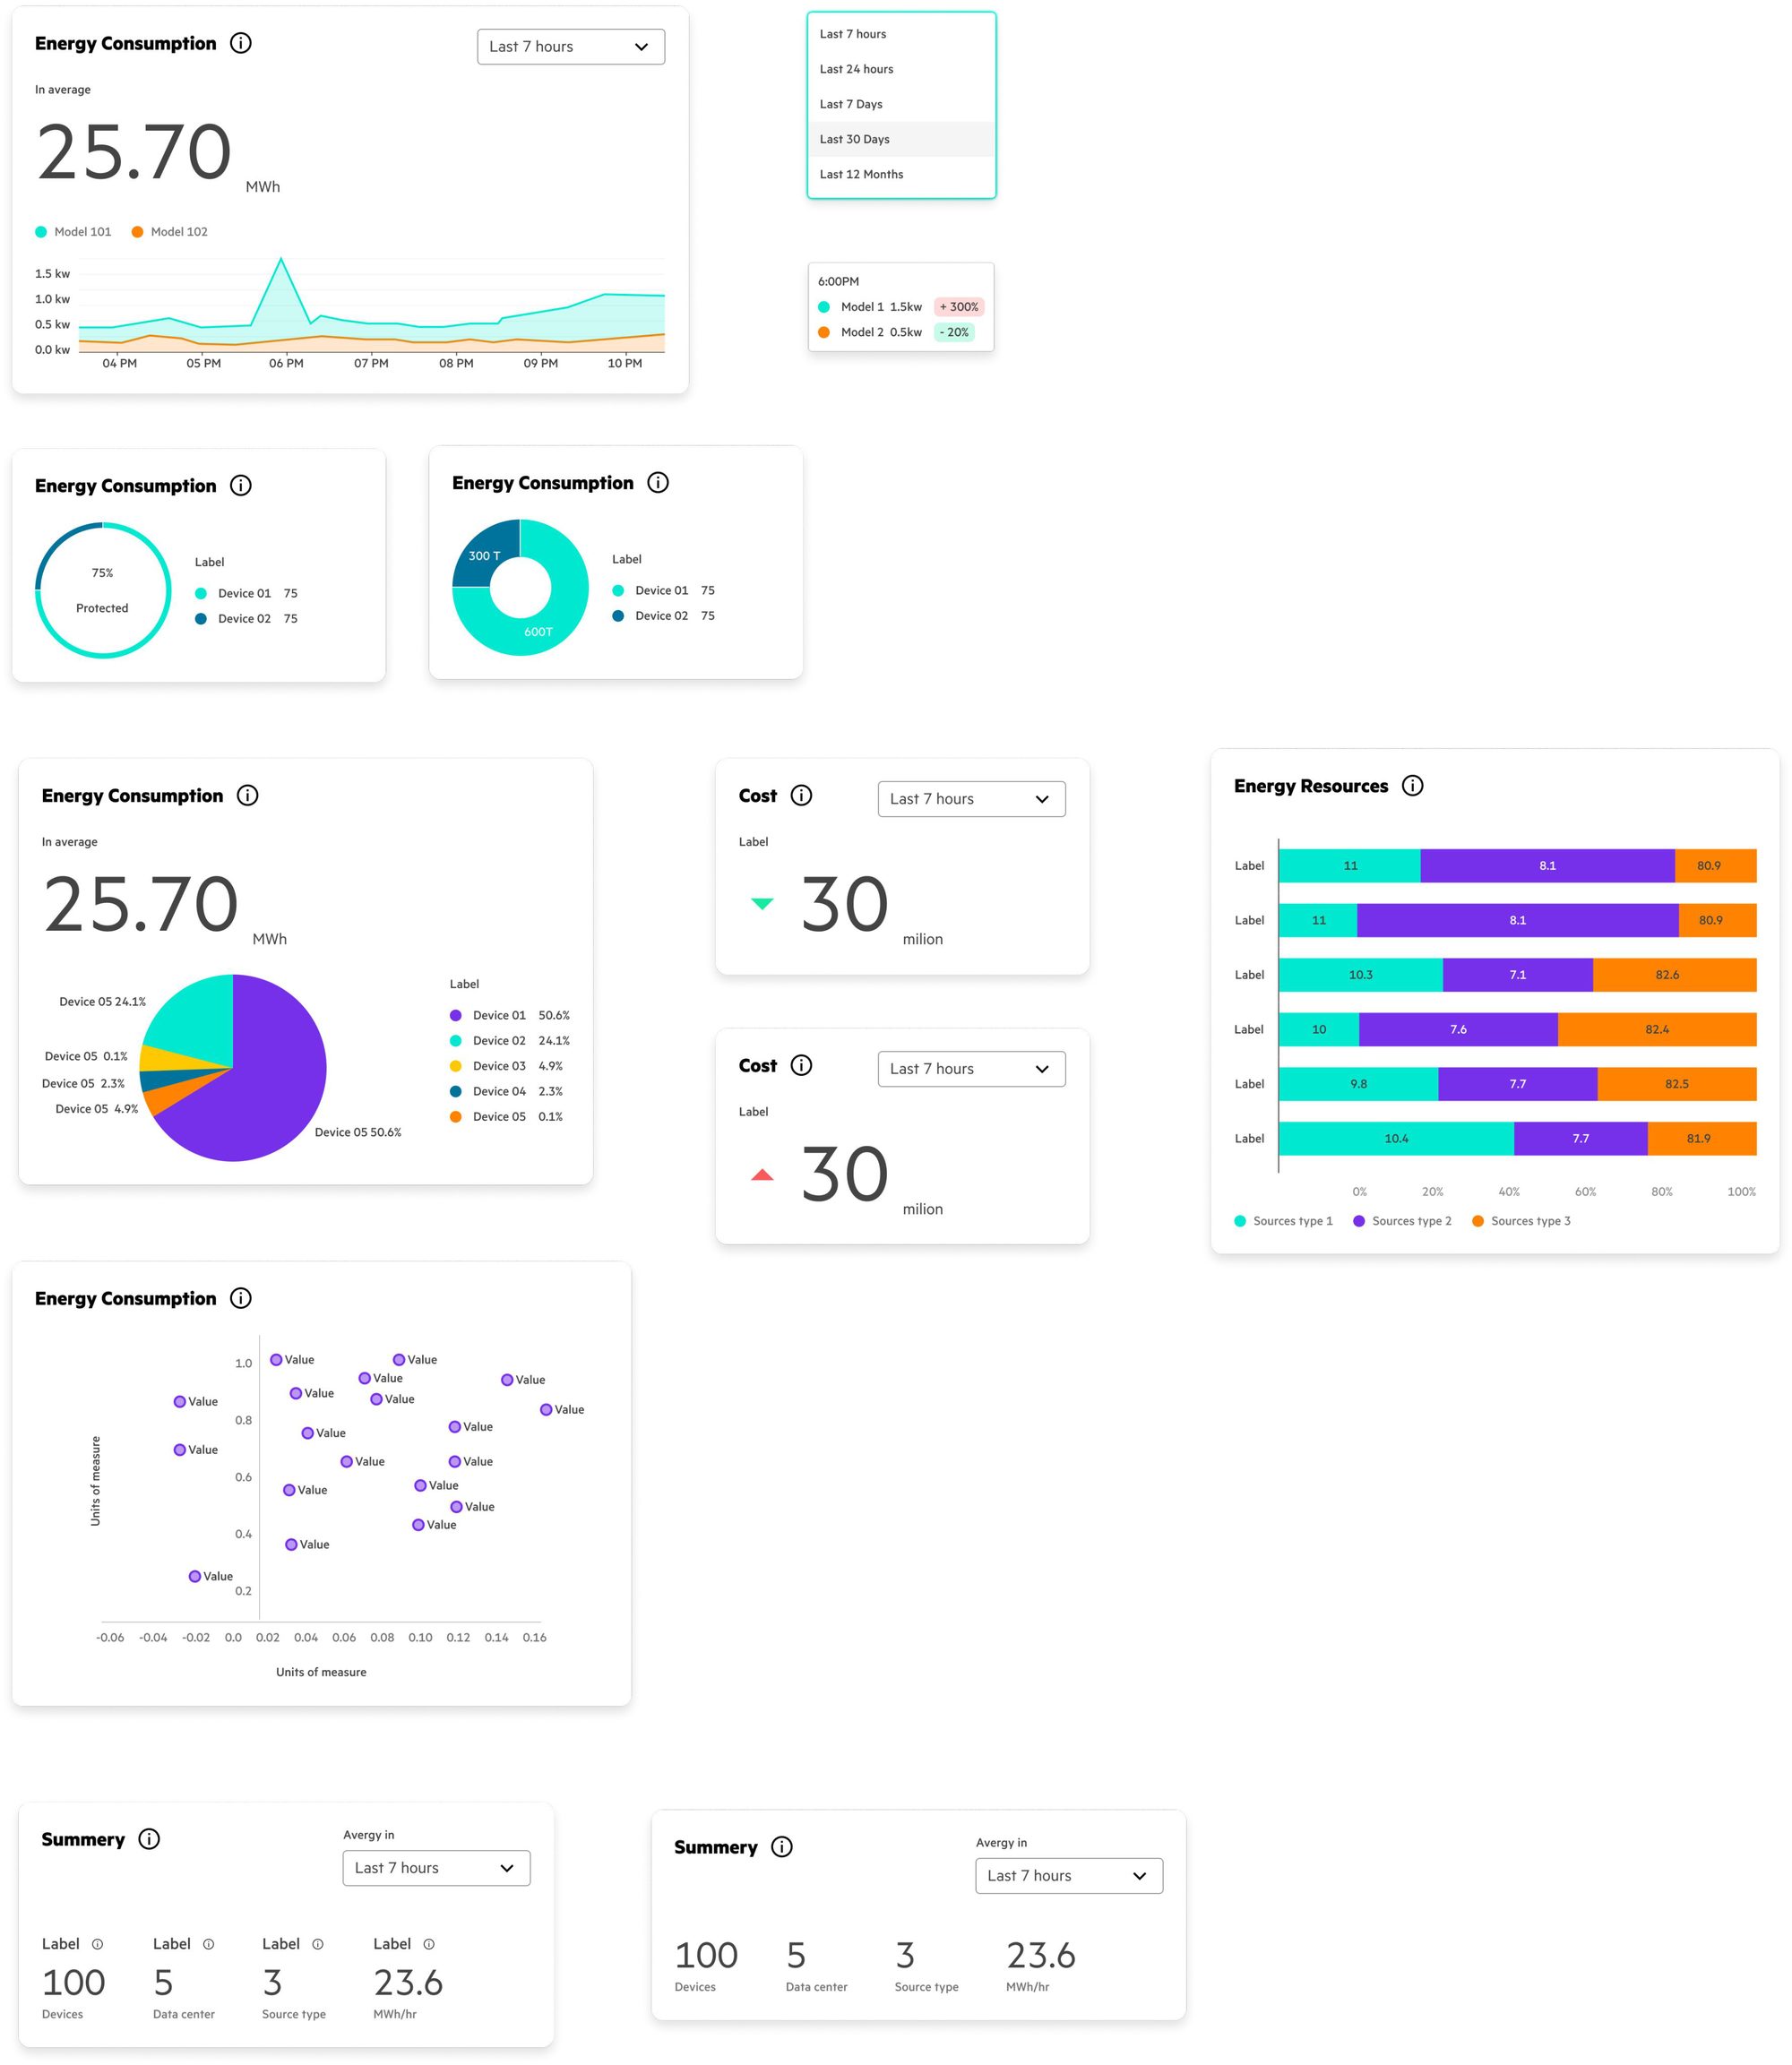
The project pushed us into new territory for the HPE Design System: dashboard customization and layout, filtering, data visualization, and date range behavior.
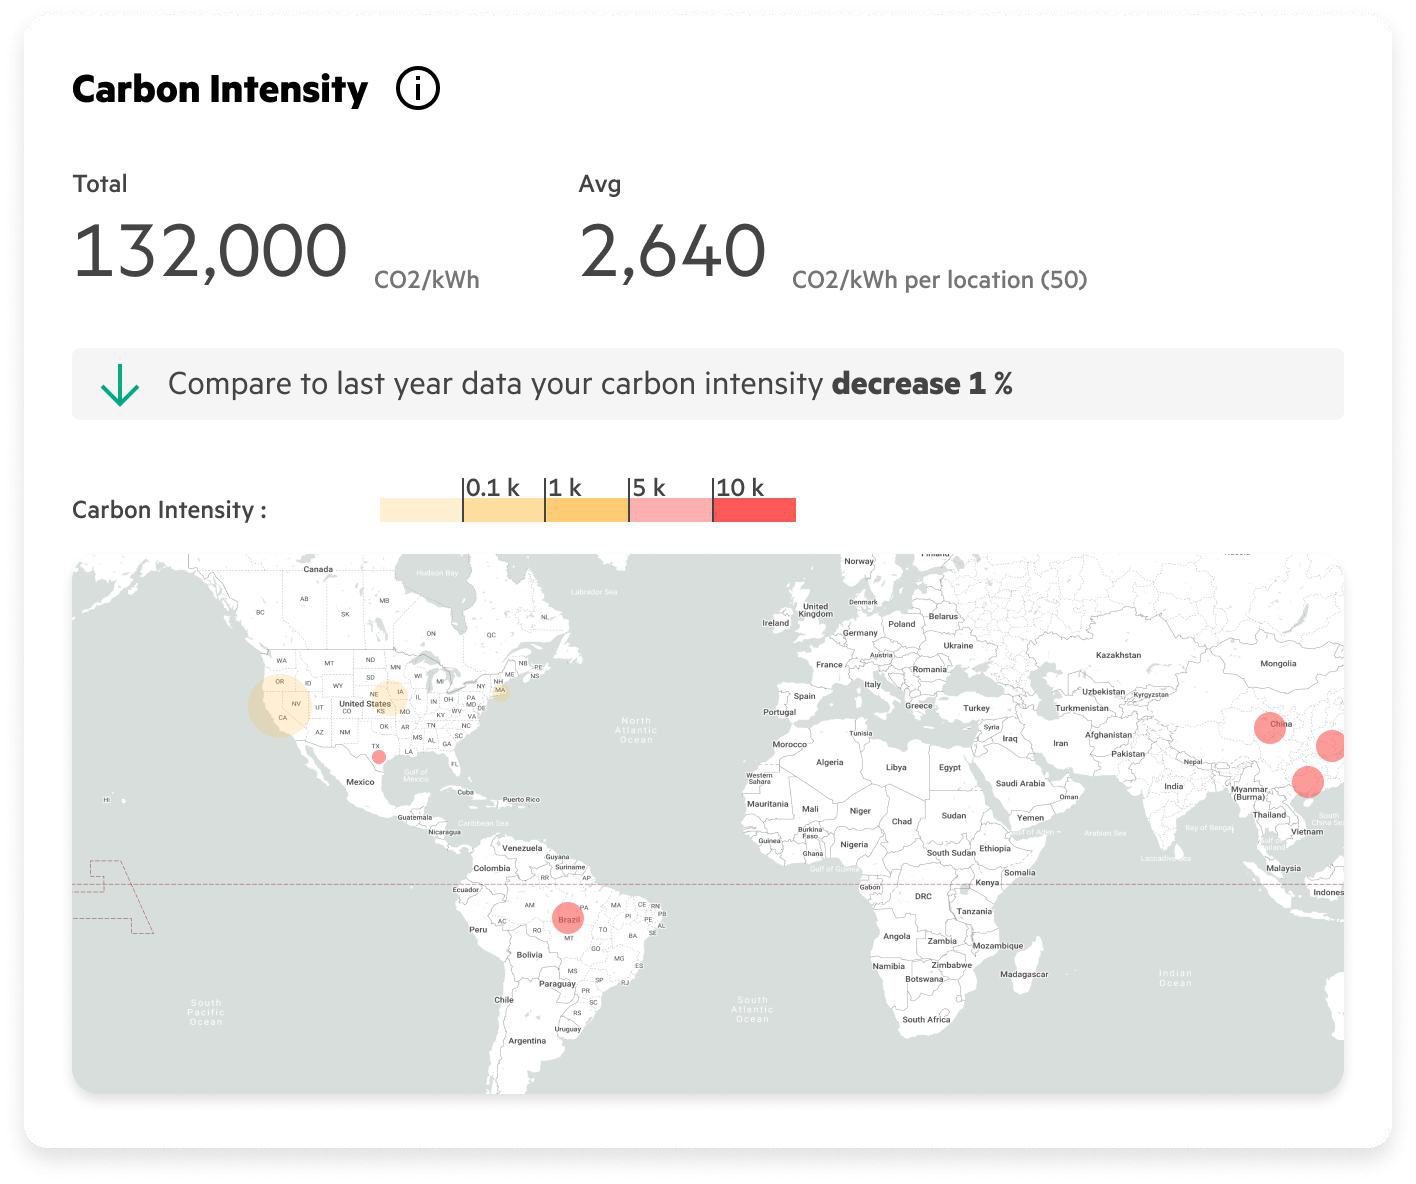
We also found that, in the time available, the data would support only three primary metrics. So the design challenge became a chance to set a vision for where the product could go next.
Influence across services
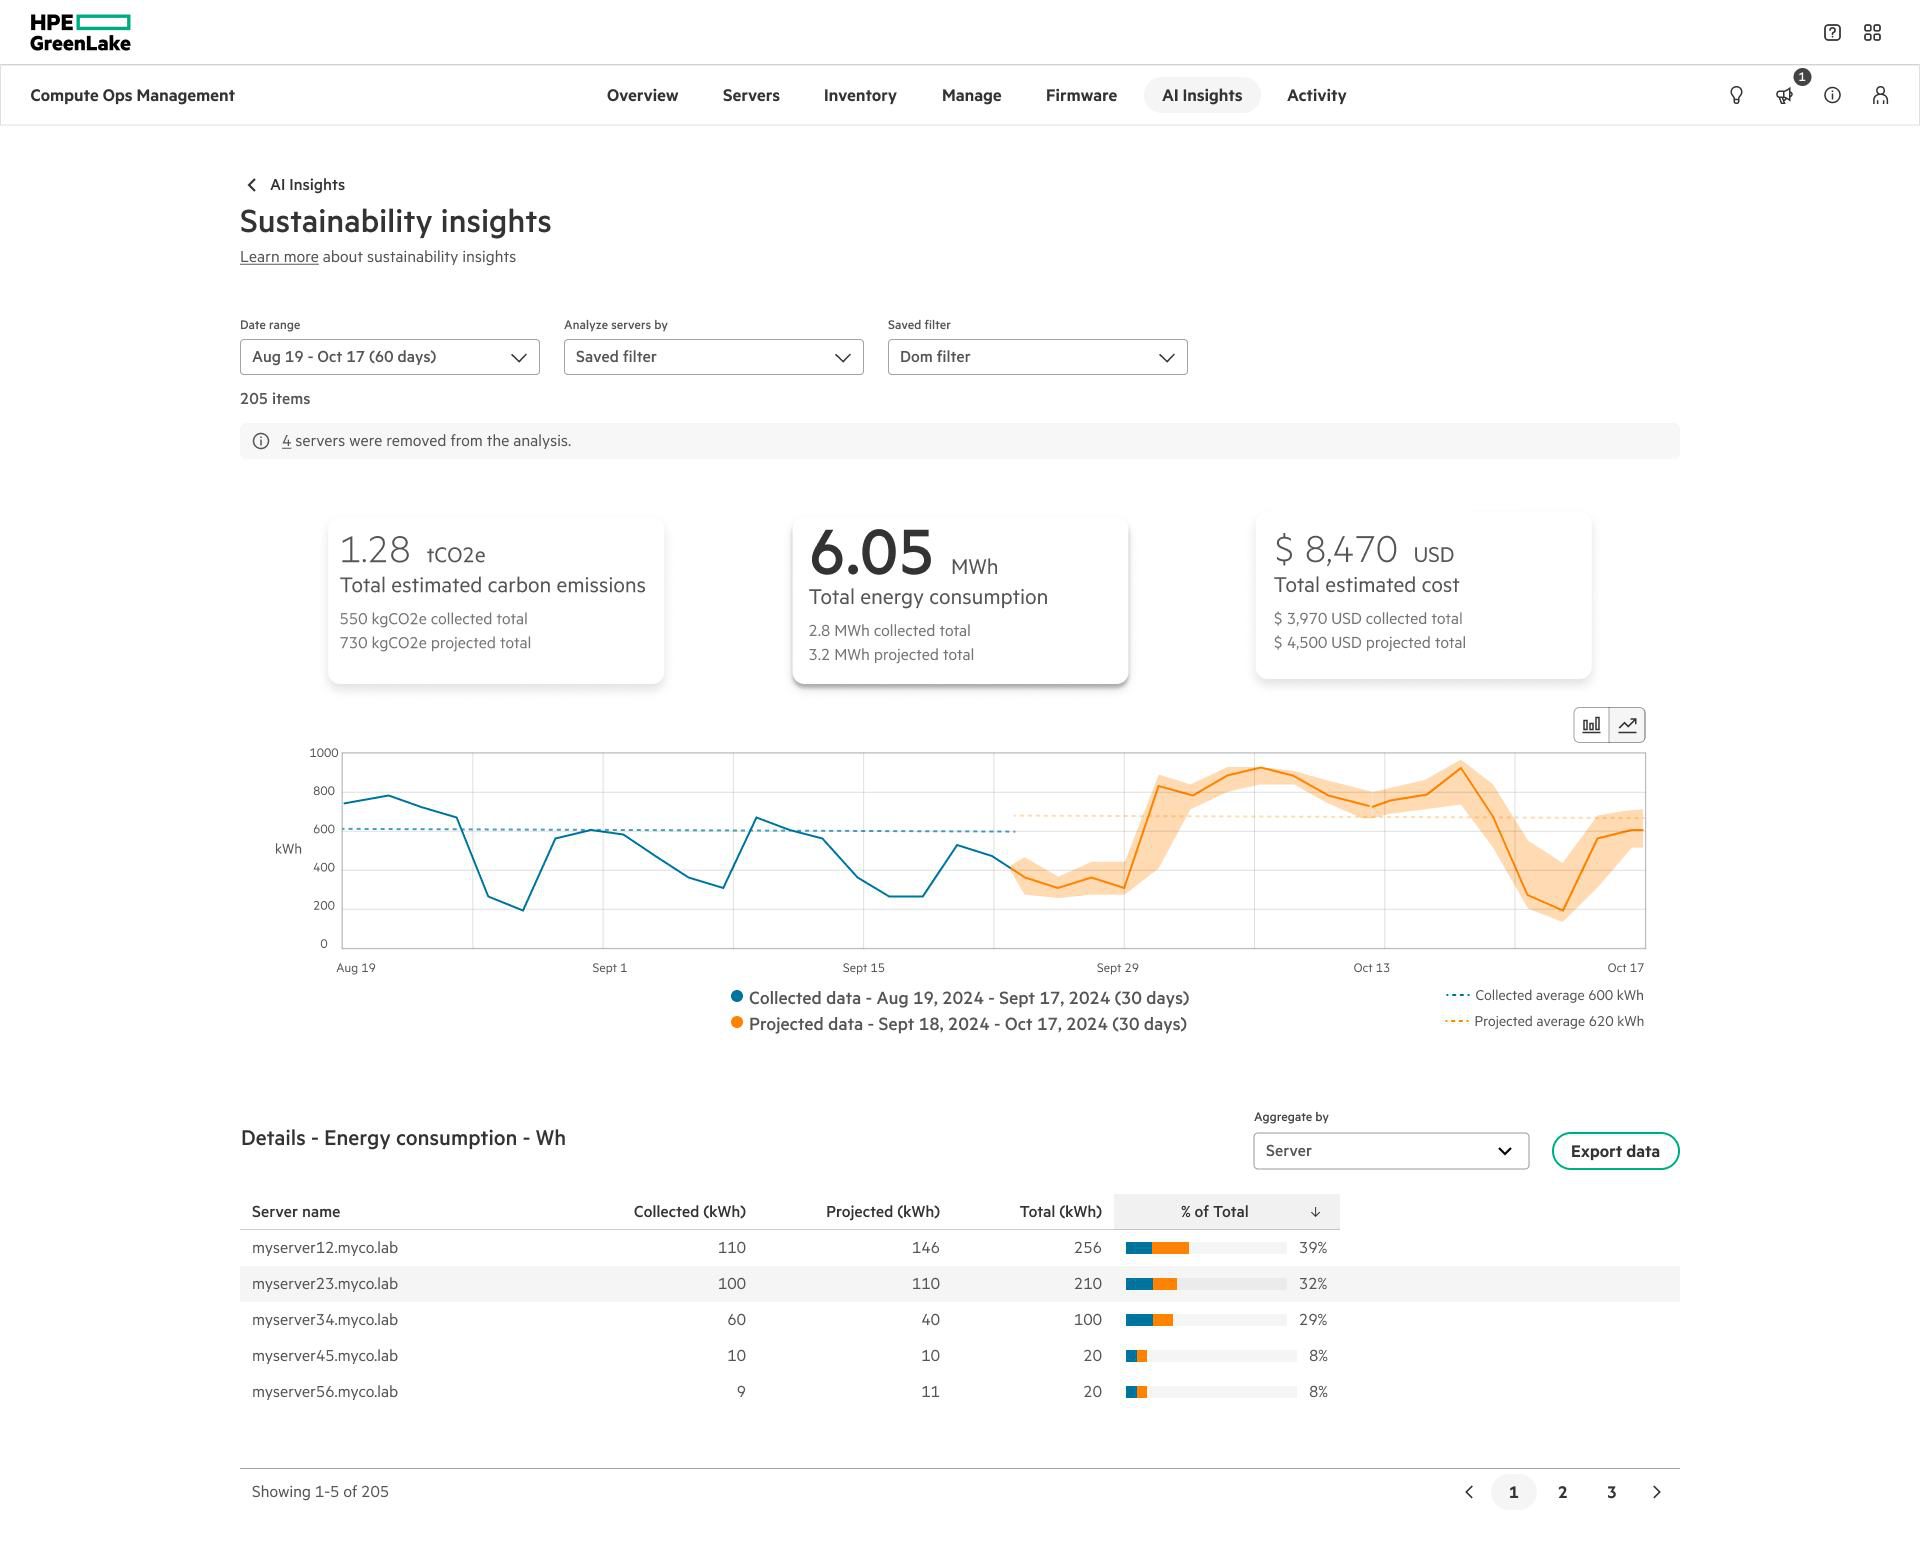
The sustainability insight center deployed on time, and a proof of concept reached networking customers ahead of schedule. With product management, we refined the details for HPE Discover 2023 in Las Vegas.
HPE Compute executives took note, and sustainability reporting became a primary initiative for Compute Ops Management. The project also let me shape further HPE Design System work, including map views, more data visualizations and charts, improved data tables, tabs and advanced filtering.
Contact
Have a complex system that needs to feel simple?
I'm glad to talk about product design leadership roles, infrastructure and developer-facing products, or design strategy work.
gregfuruiye@gmail.com